Stieltjes functions arise naturally in physics when linear differential operators with positive spectra lead to observable quantities that admit positive spectral representations.
This structure makes Padé approximants particularly powerful, enabling accurate physical predictions from perturbation series or spectral data, even when conventional methods fail.
Here are three examples of fields in physics where Stieltjes functions play an important role and Padé approximants provide powerful approximation techniques:
- Quantum anharmonic oscillator: The perturbation series for the ground-state energy of the quartic anharmonic oscillator diverges factorially at large order. Nevertheless, its Stieltjes structure provides a rigorous foundation for Padé approximation, allowing highly accurate energy estimates to be obtained from perturbative coefficients, even at strong coupling. This is an example of how a divergent series can encode remarkably precise physical information.
- Composite materials:
Predicting the effective dielectric constant or electrical conductivity of heterogeneous materials is a challenging problem, since the macroscopic response depends on the microscopic structure of the constituents. Through the spectral representations developed in Bergman–Milton theory, these effective properties can, under appropriate assumptions, be expressed as Stieltjes functions of the contrast between the constituent materials. Padé approximants and related methods can then provide accurate estimates and rigorous bounds on the effective properties. - Atomic and molecular polarizabilities:
The frequency-dependent dipole polarizability of atoms and molecules admits a spectral representation in terms of excitation energies and oscillator strengths. Under the usual assumptions, this gives rise to a Stieltjes structure in the squared frequency. The associated moment problem is the foundation of the Stieltjes imaging technique, which uses Padé-related approximations to reconstruct photoabsorption spectra and photoionization cross sections from discrete variational calculations.
Despite their different physical origins, these examples share a common mathematical structure: positive spectral representations make it possible to exploit the special properties of Stieltjes functions and the convergence behavior of Padé approximants.


 and coincides with
  for
for  ) and the Stieltjes function is:
 denotes the principal branch, with cut along
 ![(-\infty,-1]](https://s0.wp.com/latex.php?latex=%28-%5Cinfty%2C-1%5D&bg=ffffff&fg=000&s=0&c=20201002) ). Thus
). Thus  is analytic in
 ![\mathbb{C}\setminus(-\infty,-1]](https://s0.wp.com/latex.php?latex=%5Cmathbb%7BC%7D%5Csetminus%28-%5Cinfty%2C-1%5D&bg=ffffff&fg=000&s=0&c=20201002) .
.![\mathbb{C}\setminus(-\infty,0]](https://s0.wp.com/latex.php?latex=%5Cmathbb%7BC%7D%5Csetminus%28-%5Cinfty%2C0%5D&bg=ffffff&fg=000&s=0&c=20201002) (in the present example the natural cut is actually shorter:
(in the present example the natural cut is actually shorter:  for all
  .
. as
as  in the cut complex plane, under appropriate assumptions on
  .
. as
as  in the cut complex plane.
 is Herglotz (i.e.,
  has the same sign as
  ).
).
 for all
  and the moments of
  , the Stieltjes function has the following asymptotic expansion:


 can grow sufficiently rapidly for the series to have zero radius of convergence. Let begin the exploration of Stieltjes functions with an example. Let set
  . We have:


 .
.
 , we obtain the target integral
  . Expanding
  as a formal power series and integrating term by term leads to the series:
 , the series transforms into a dense power series in
  ,
,  . We then construct its diagonal Padé approximants
 ](https://s0.wp.com/latex.php?latex=%5BN%2FN%5D%28x%29&bg=ffffff&fg=000&s=0&c=20201002) evaluated at
evaluated at  .
.![[5/5]](https://s0.wp.com/latex.php?latex=%5B5%2F5%5D&bg=ffffff&fg=000&s=0&c=20201002) Padé approximant using the pracma package (note: coefficients must be supplied in decreasing order of powers for pracma::pade):
Padé approximant using the pracma package (note: coefficients must be supplied in decreasing order of powers for pracma::pade): ).
). the value 1 for the series from the
  , we can see that the values first converge towards the exact value and then move away from it (see table below). This reminds us of the

 (
( ), we have:


 ) and an upper bound (
 ) for the error made when evaluating the Stieltjes integral using the sum derived above.


 and
and  . The approximation, error, and corresponding upper and lower bounds for the error are shown for


 we have
  = 1. This is the solution to the unperturbed problem. We observe that:


 and using
  in the formula above we obtain:


 . Finally we have:


 is a constant force. The Schrödinger equation then becomes

 (in quantum mechanics, it marks the transition between an oscillatory (classically allowed) region and an exponentially decaying (classically forbidden) region) defined by


 , the solution is oscillatory, whereas in a region where
  , it exhibits exponential behavior. The Airy function provides the transition between these two regimes (see fig. below).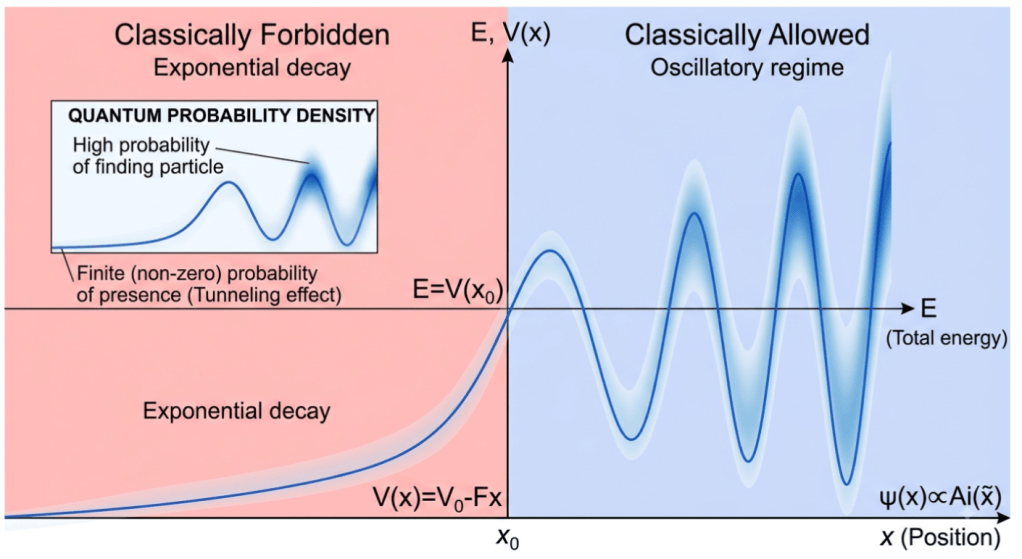


 is correct:


 as:
as:


